~ 3 min read
Discover Chart-GPT: Transform Text into Stunning Charts Instantly

As an AI enthusiast, I'm always on the lookout for new AI-powered tools and technologies to make my life easier. Recently, I stumbled upon Chart-GPT, a game-changing tool that transforms text into beautiful charts within seconds with the help of OpenAI's APIs.
The moment I discovered it, I knew I had to try it out and share my experience with you all. So, in this blog post, I'll guide you through the installation process of Chart-GPT so you, too, can start exploring its powerful capabilities.
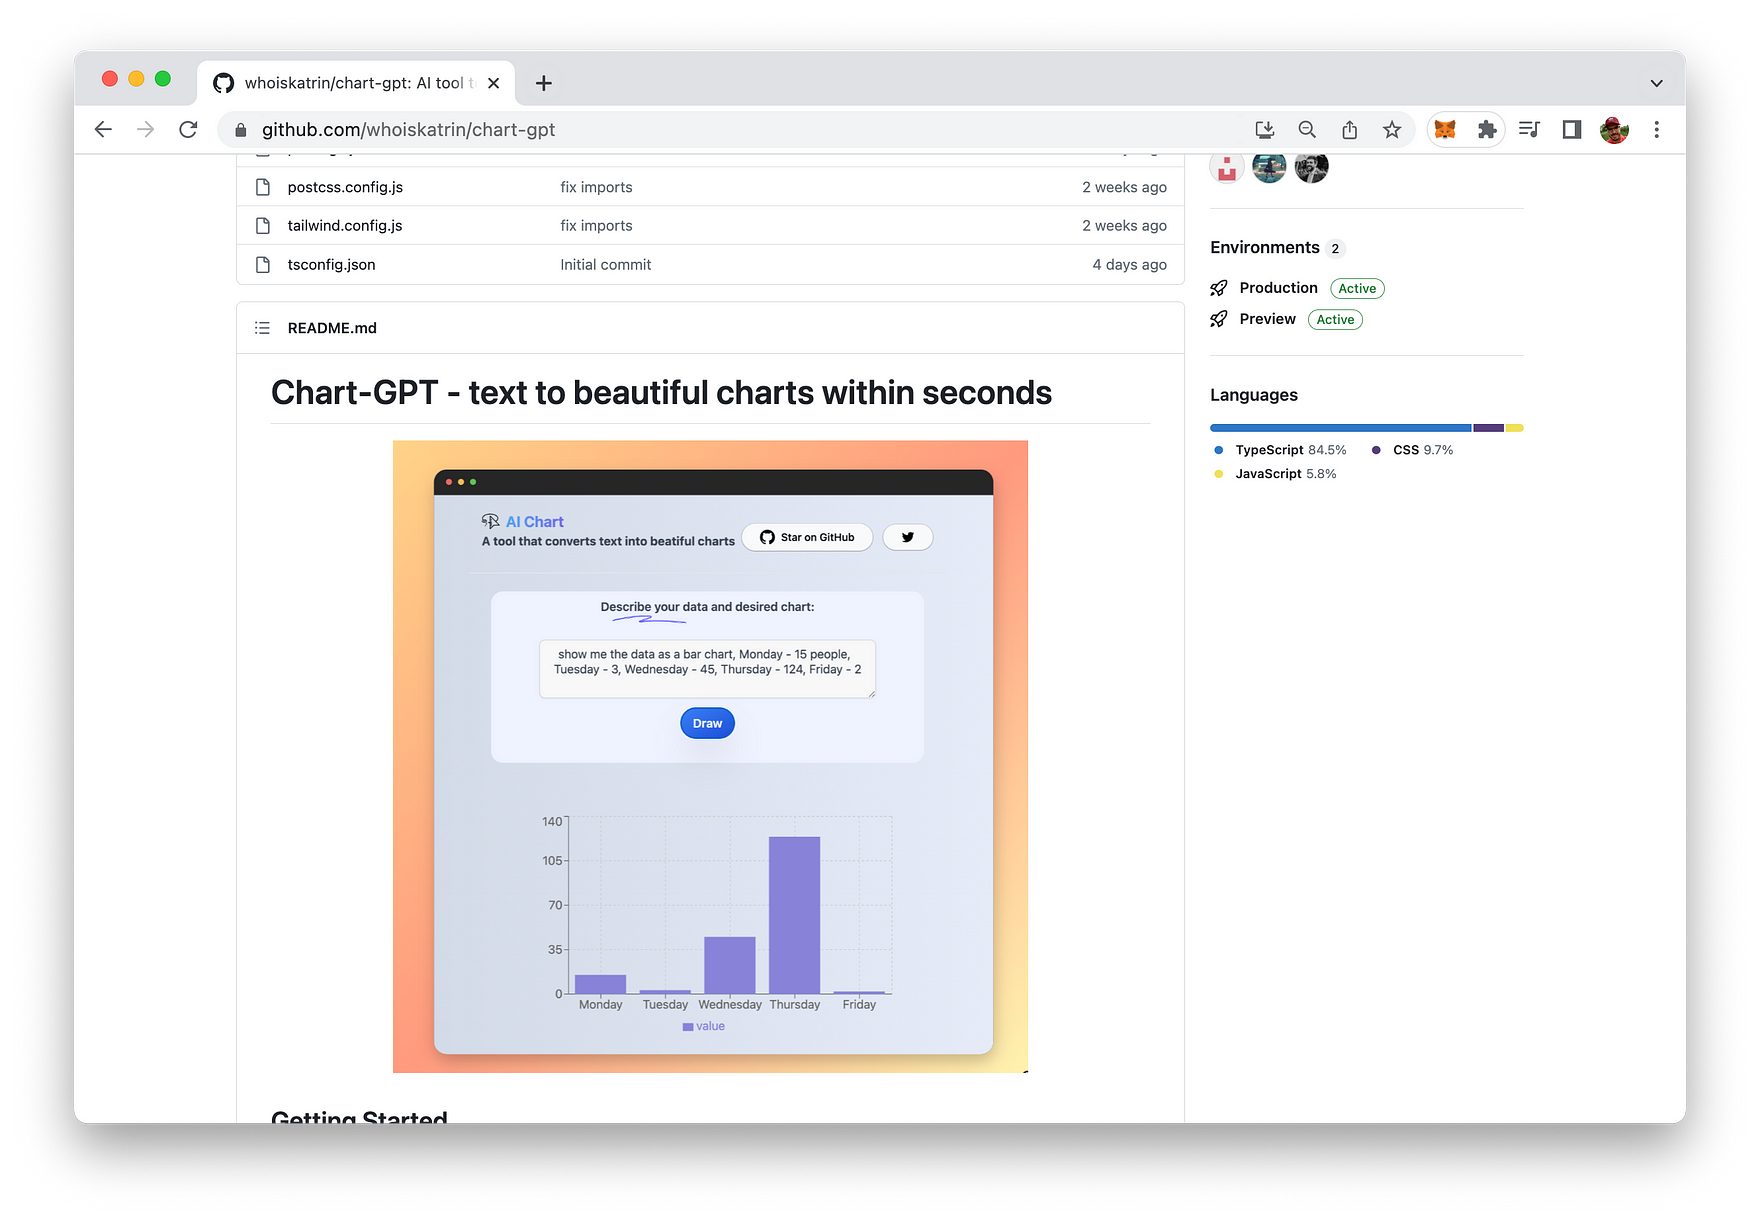
Chart-GPT is available on GitHub at: https://github.com/whoiskatrin/chart-gpt:
Step 1: Clone the Repository
To begin our journey, we'll first need to get our hands on the Chart-GPT codebase. Thankfully, this is a breeze with Git. Open up your favorite terminal or command prompt and run the following command:
git clone https://github.com/whoiskatrin/chart-gpt.gitThis command will create a new directory called chart-gpt on your local machine and download the necessary files into it.
Step 2: Enter the Chart-GPT Directory
With the repository cloned, it's time to navigate to the new chart-gpt directory. Simply run:
cd chart-gptNow we're inside the Chart-GPT directory, where all the magic happens!
Step 3: Set Up Your Environment Variables
Before diving in, we need to configure a few settings. Chart-GPT uses environment variables to manage your OpenAI API key. First, create a copy of the .env.example template:
cp .env.example .envThis command duplicates the .env.example file, creating a new file called .env. Open this file in your preferred text editor and replace your-api-key with your actual OpenAI API key:
OPENAI_API_KEY="your-api-key"Make sure to save the changes and close the file.
Step 4: Install Dependencies and Start the Development Server
We're almost there! Now it's time to install the required dependencies for Chart-GPT. If you're using npm, run:
npm installAlternatively, if you prefer yarn, run:
yarnWith the dependencies installed, we can finally start the development server. For npm users, execute:
npm run dev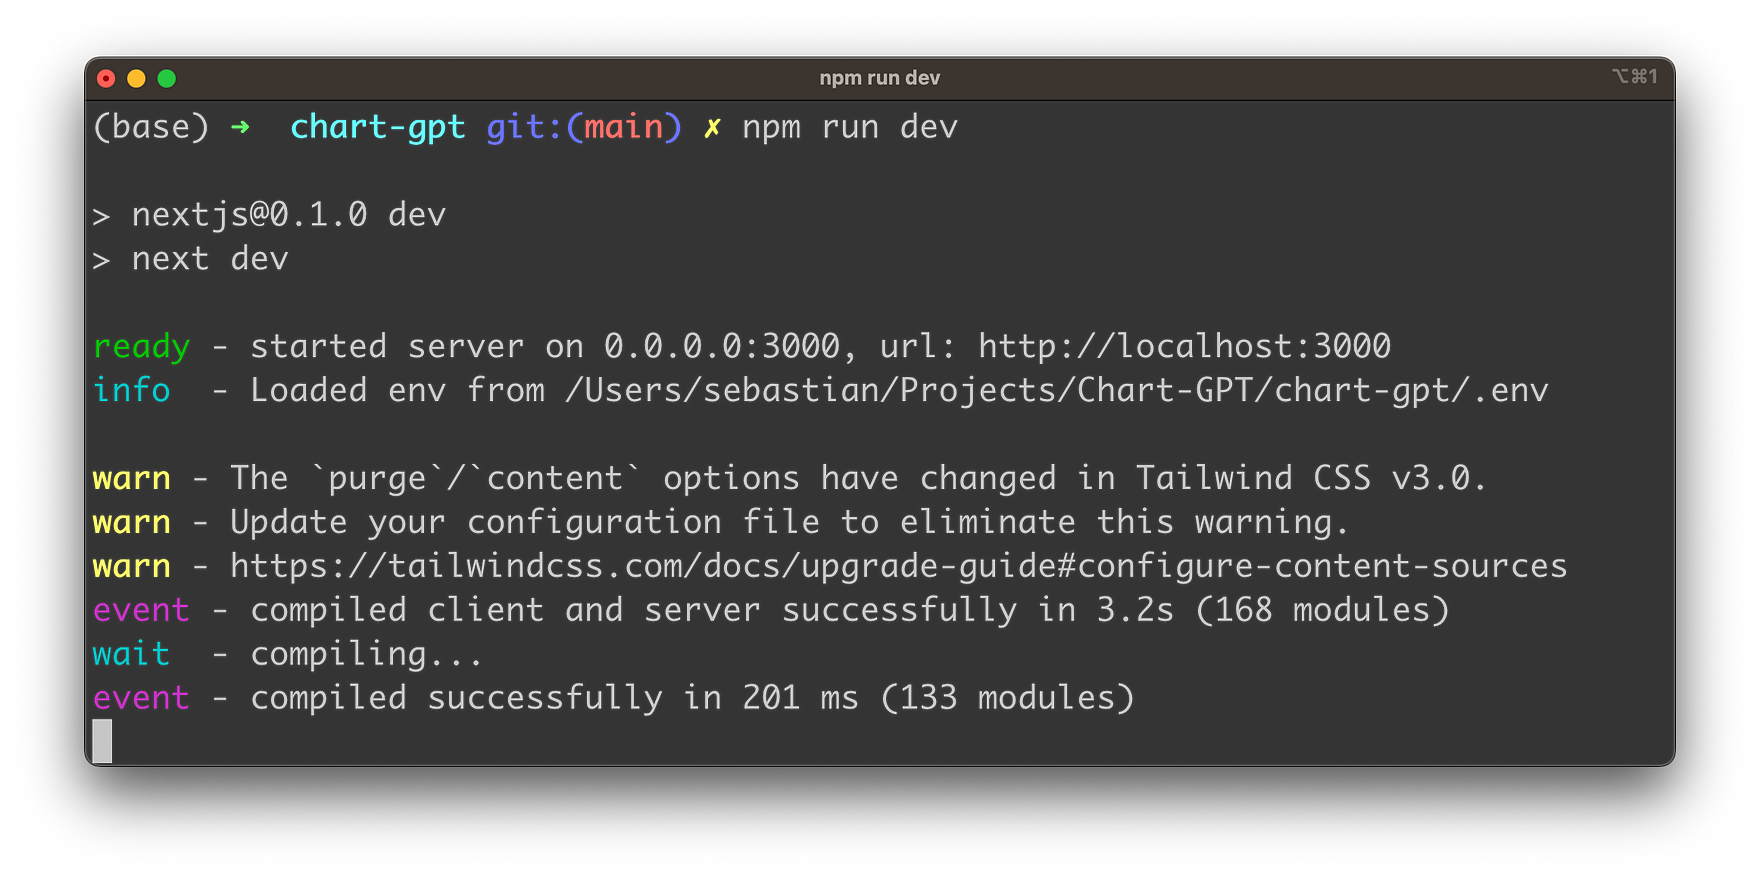
For yarn users, run:
yarn devAnd voilà! The development server is up and running at http://localhost:3000. Open your favorite web browser, type in the address, and get ready to experience the power of Chart-GPT.
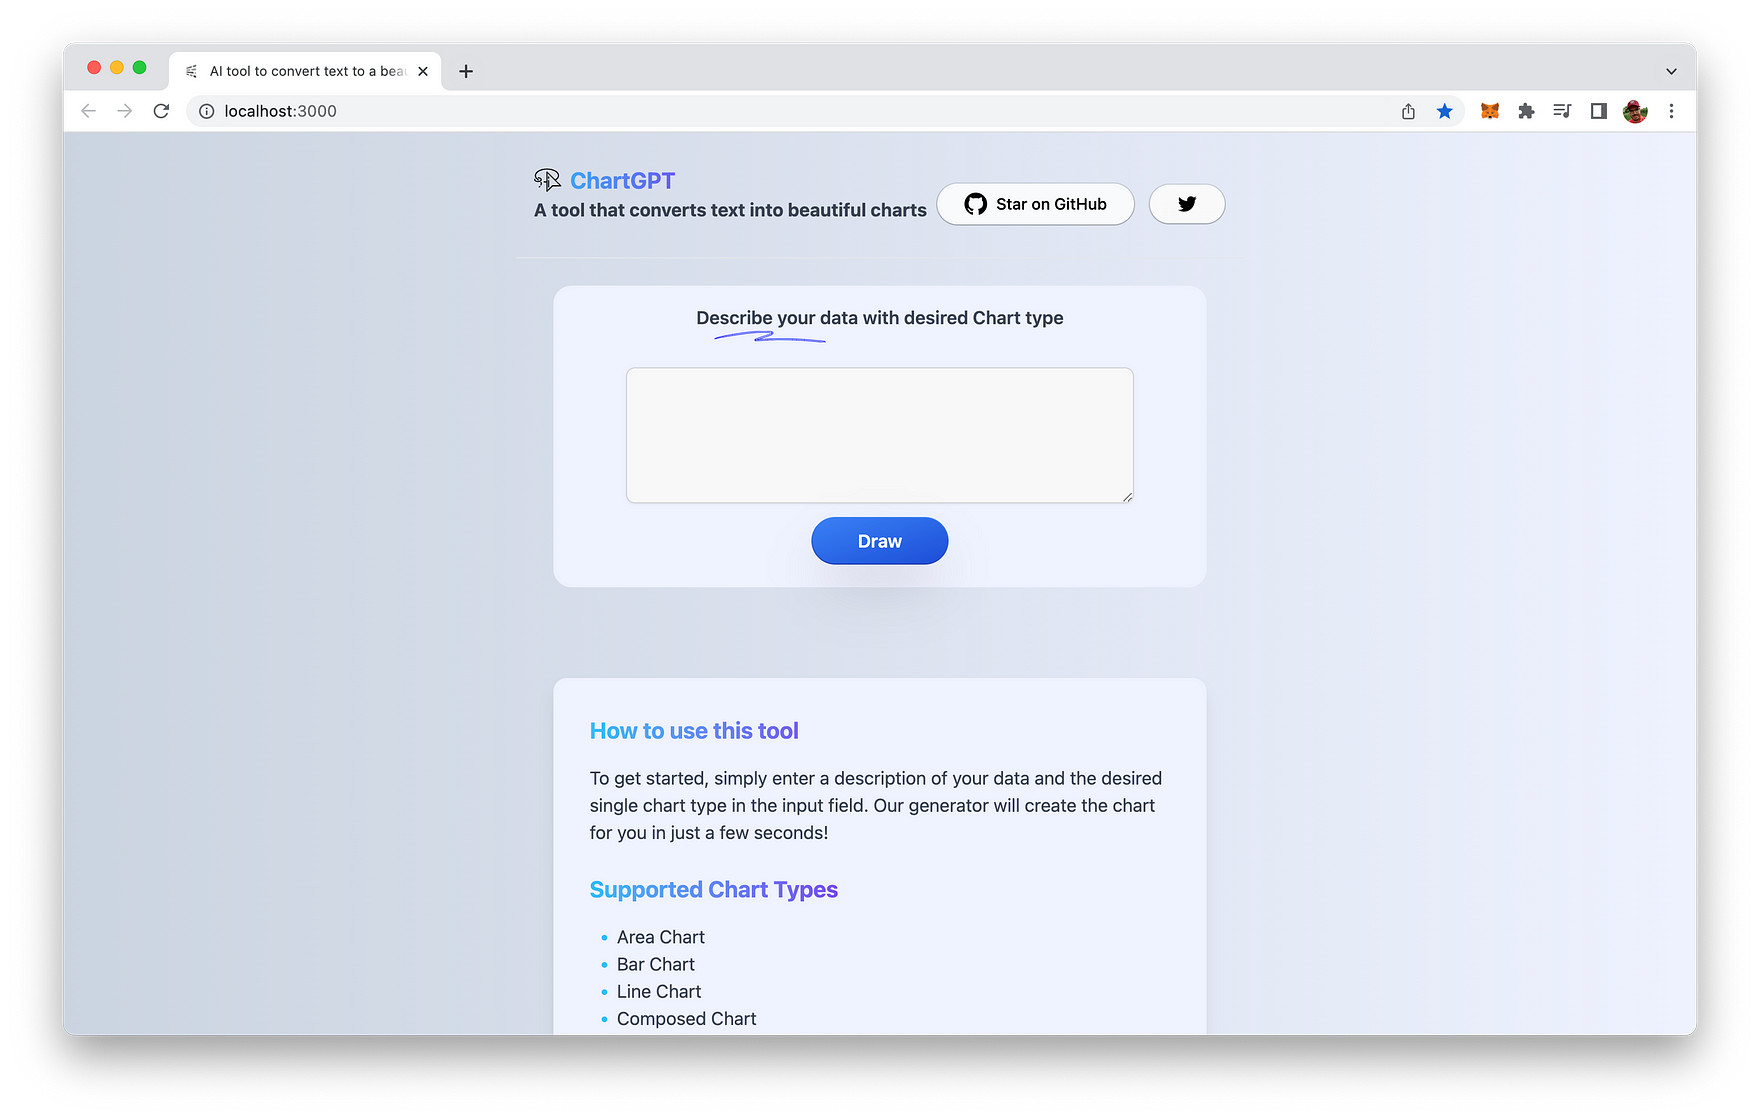
Step 5: Generate Your Charts
To get started, simply enter a description of your data and the desired chart type in the input field. The following chart types are supported by Chart-GPT:
- Area Chart
- Bar Chart
- Line Chart
- Composed Chart
- Scatter Chart
- Pie Chart
- Radar Chart
- Radial Bar Chart
- Treemap
- Funnel Chart
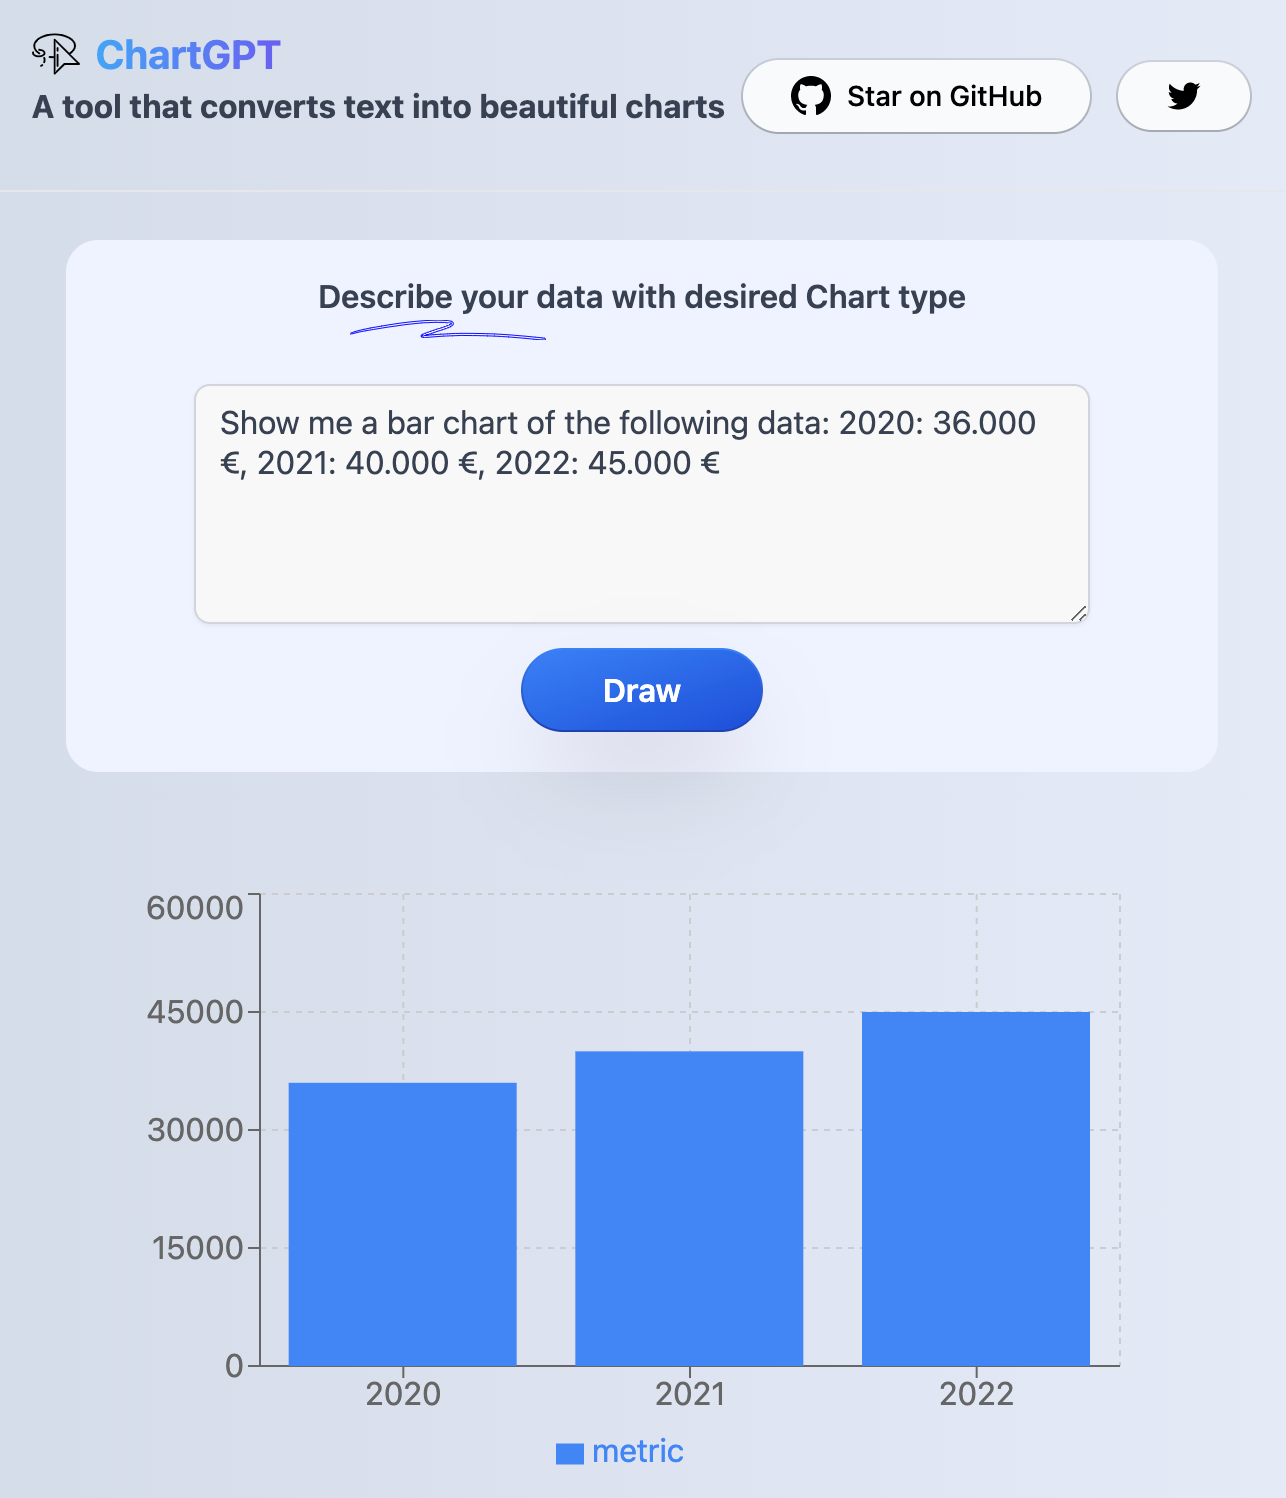
Here is a simple example:
Conclusion
With Chart-GPT now at your fingertips, you're equipped to transform plain text into stunning visual representations within seconds. This powerful tool is not only a testament to the capabilities of AI but also a fantastic resource for those seeking to communicate complex data more effectively.
As you experiment with the various chart types supported by Chart-GPT, you'll soon discover how this cutting-edge tool simplifies the process of data visualization, enabling you to focus on the story behind the data. Whether you're creating reports, presentations, or just exploring data for personal insights, Chart-GPT is poised to become an indispensable ally in your data visualization journey.